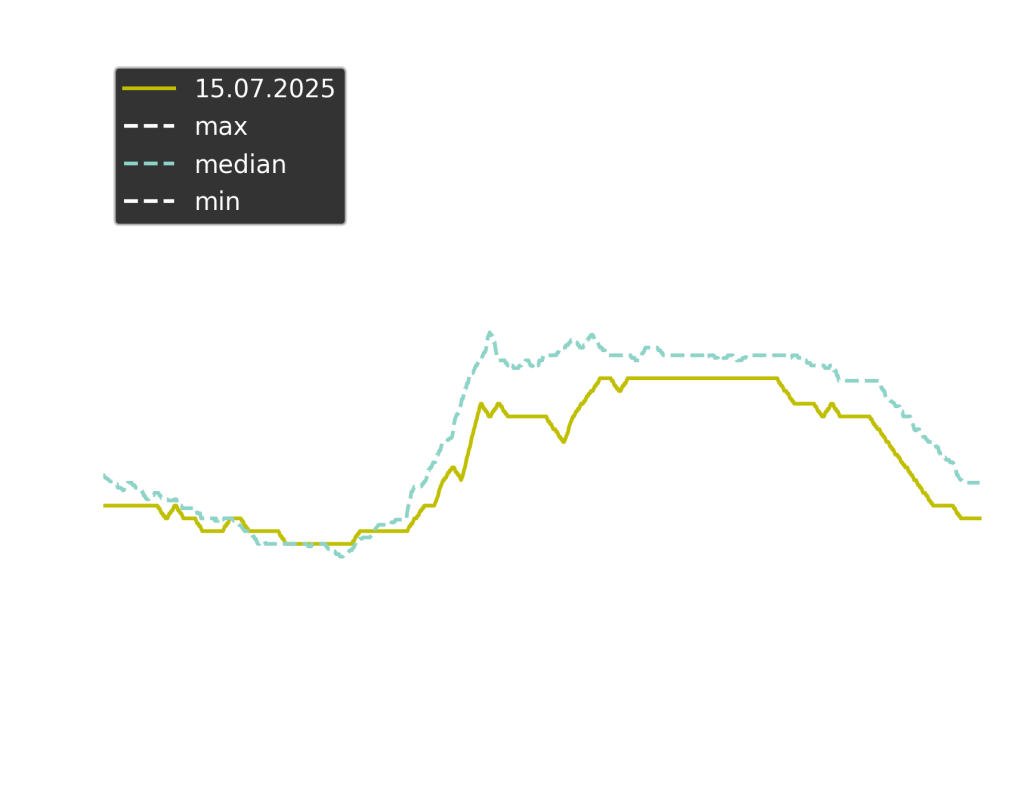
A FRITZ!Box can be configured to send daily E-Mail reports. These are downloaded using the Gmail API. The temperature data has to be extracted from pixel images. Power & temperature data over time are saved into a csv file and can be analyzed using a Jupyter notebook.
The main advantage of this complex approach is that no server is required to log the data. The data is stored in e-mails and can be retrieved in batch.
See also these blog posts:
https://gerritnowald.wordpress.com/2025/07/21/downloading-email-reports-using-the-gmail-api/
https://gerritnowald.wordpress.com/2025/07/23/from-pixels-to-data-extracting-temperature-values-from-images/
-
set up Gmail API
-
put
credentials.jsoninto.\authentication\ -
Install dependencies
pip install -r requirements.txt-
in Gmail, set up a filter to apply a label to the reports
-
get the corresponding
LabelIDusing
python get_label_ids.pyDownload report attachements:
python download_email_data.py LabelIDDigitalize temperature graphs and append to data.csv:
python digitalize_temperature.pyUse the Jupyter notebook analysis.ipynb to create graphs.
Simonas Viliūnas for providing a great starting point
https://github.com/vilisimo/examples/tree/main/gmail