Proposal
Add syntax for annotating individual data points on xychart line plots with custom text labels. This enables use cases like labeling specific models on a benchmark chart or marking milestones on a trend line.
The proposed syntax extends the existing data array format — each numeric value can optionally be followed by a quoted string:
xychart
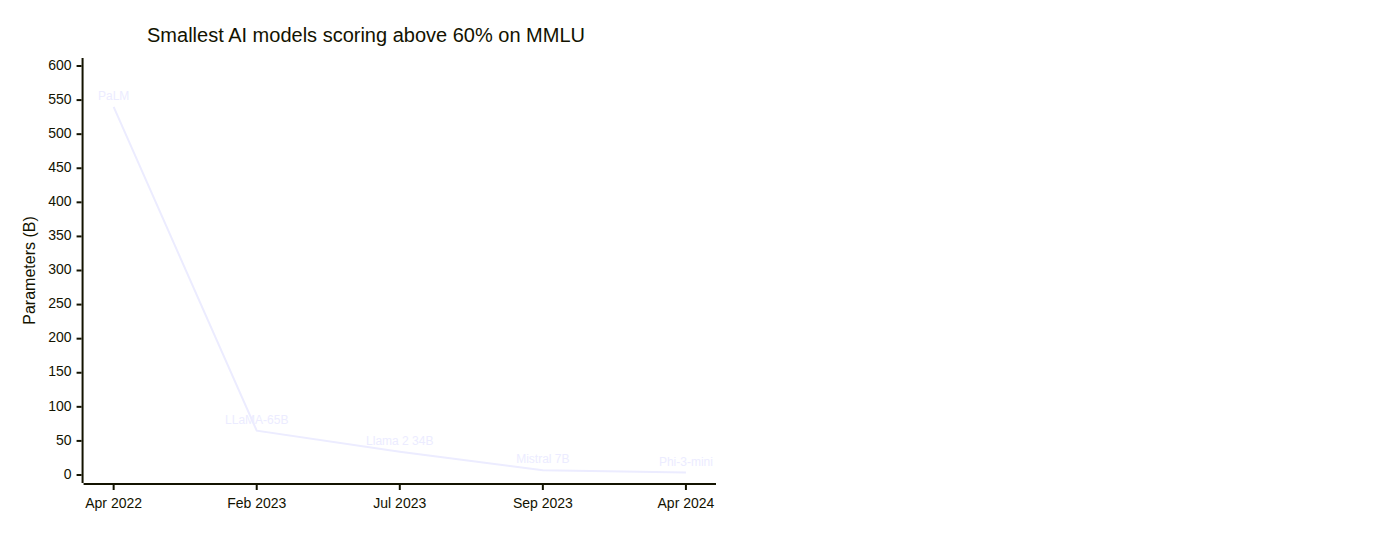
title "Smallest AI models scoring above 60% on MMLU"
x-axis "Date" ["Apr 2022", "Feb 2023", "Jul 2023", "Sep 2023", "Apr 2024"]
y-axis "Parameters (B)" 0 --> 600
line [540 "PaLM", 65 "LLaMA-65B", 34 "Llama 2 34B", 7 "Mistral 7B", 3.8 "Phi-3-mini"]
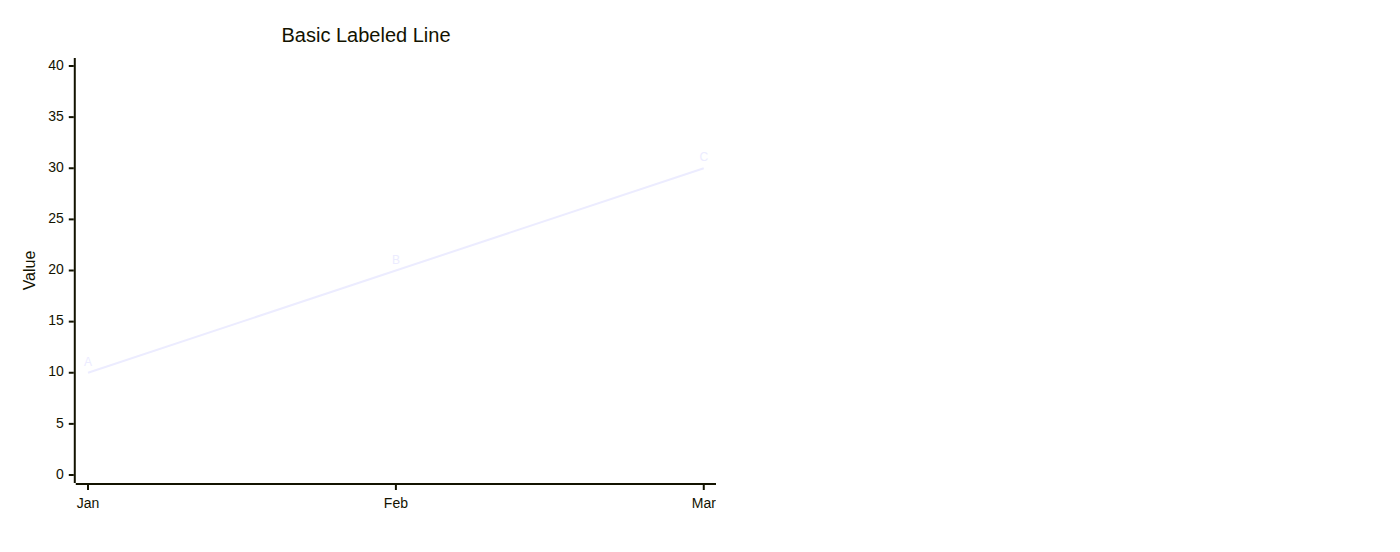
Labels are optional per point — unlabeled points work as before:
line [10 "Start", 20, 30 "End"]
Rendering: labels appear above points (vertical orientation) or to the right (horizontal), using the line's stroke color. Fully backward-compatible.
Related: this was partially discussed in the "points of interest" section of Discussion #5326. Also related to (but distinct from) closed issue #5806 which was about config-based numeric data labels on bars.
Example
Mixed labeled and unlabeled points:
xychart
    title "Quarterly Performance"
    x-axis [Q1, Q2, Q3, Q4]
    y-axis "Revenue ($M)" 0 --> 100
    line [25 "Launch", 45, 72, 90 "Target Hit"]
Screenshots
Proposal
Add syntax for annotating individual data points on xychart line plots with custom text labels. This enables use cases like labeling specific models on a benchmark chart or marking milestones on a trend line.
The proposed syntax extends the existing data array format — each numeric value can optionally be followed by a quoted string:
Labels are optional per point — unlabeled points work as before:
Rendering: labels appear above points (vertical orientation) or to the right (horizontal), using the line's stroke color. Fully backward-compatible.
Related: this was partially discussed in the "points of interest" section of Discussion #5326. Also related to (but distinct from) closed issue #5806 which was about config-based numeric data labels on bars.
Example
Mixed labeled and unlabeled points:
Screenshots